
Key Performance Indicators (KPIs) are essential metrics that help associations measure their success and make informed decisions. Setting up customizable KPI dashboards using Association Management Software empowers associations to track their progress effectively and ensure that they are on the right path to achieving their goals.
This blog will guide you through the process of understanding KPIs, choosing the right ones for your association, setting up KPI dashboards, and making data-driven decisions.
Key Takeaways
- Key Performance Indicators (KPIs) help associations measure success, such as membership growth and event attendance.
- Selecting the right KPIs involves aligning them with organizational goals and involving stakeholders in the selection process.
- Effective KPI dashboards are configured through AMS platforms, offering customizable layouts and real-time analytics.
- KPI dashboards should be user-friendly and regularly updated to highlight the most crucial metrics.
- Glue Up’s customizable dashboards allow associations to define and track specific KPIs, visualize data clearly, and generate detailed reports. Book a demo to explore how Glue Up can meet your needs.
Understanding Key Performance Indicators (KPIs) for Associations

Key performance indicators are quantifiable measures that reflect an organization's performance in achieving its objectives. For associations, KPIs provide a clear picture of how well they are meeting their goals, whether it's membership growth, event attendance, or financial health.
However, monitoring these indicators helps associations identify areas of success and areas that need improvement, allowing for strategic decision-making that drives the organization forward.
Common KPIs for Associations
Associations typically track a variety of KPIs, including:
- Membership Growth: The rate at which new members join the association.
- Event Attendance: The number of participants at events hosted by the association.
- Financial Metrics: Revenue generated from memberships, events, and other activities.
These KPIs offer a snapshot of the association's health and help leaders make informed decisions about where to allocate resources and focus their efforts.
How KPIs Help in Strategic Decision-Making
KPIs are not just numbers; they are strategic tools that guide decision-making. Regularly reviewing KPIs helps association leaders identify trends, assess the effectiveness of their initiatives, and make adjustments as needed.
This data-driven approach certifies that the association remains aligned with its goals and can respond proactively to challenges and opportunities.
Choosing the Right KPIs for Your Association

The first step in setting up a KPI dashboard is selecting the right KPIs. This process starts with understanding your association's specific goals. Whether your focus is on increasing membership, enhancing member engagement, or improving financial stability, the KPIs you choose should directly reflect these objectives.
Aligning KPIs with Organizational Objectives
Once you've identified your goals, it's crucial to align your KPIs with the broader organizational objectives. This alignment guarantees that every metric you track contributes to the overall mission of the association. For example, if your objective is to boost member retention, tracking KPIs related to membership renewals and member satisfaction will be key.
Setting Up KPI Dashboards with AMS
Association Management Software (AMS) provides powerful tools for creating and managing KPI dashboards. These platforms offer features such as customizable layouts, integration with various data sources, and real-time analytics, making it easier to track and analyze key metrics.
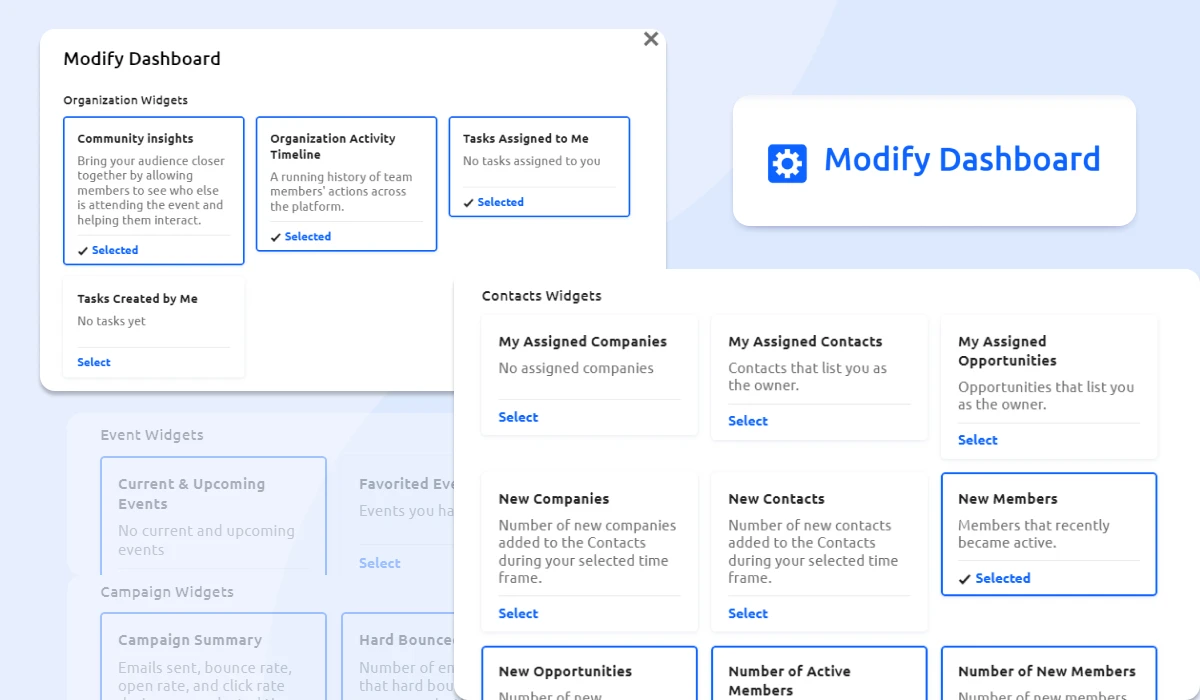
Configuring Dashboard Layouts and Widgets
When setting up your KPI dashboard, consider how the layout and widgets will display the data. AMS platforms typically allow for a high degree of customization, so you can arrange the information in a way that is most intuitive for your team.
Key metrics should be prominently displayed, and widgets can be used to drill down into specific data points for more detailed analysis.
Customizing Reports and Visualizations
Customizable reports and visualizations are essential for effectively communicating KPI data. AMS platforms enable you to generate reports tailored to your needs, whether it's a summary for the board of directors or detailed analytics for department heads. Visualizations like charts and graphs make it easier to interpret data and spot trends at a glance.
Statistics show that people can retain 65% of the information three days after watching an image with data, compared to only 10% of the information they hear, highlighting the importance of effective visual reporting.
Best Practices for Effective KPI Dashboards

A KPI dashboard is only as useful as its usability. Design your dashboard to be user-friendly and intuitive so that all stakeholders can easily access and understand the data. Avoid clutter, focus on the most important KPIs, and ensure that the dashboard is accessible to those who need it.
Ensuring Data Accuracy and Timeliness
Accurate and up-to-date data is critical for making informed decisions. Regularly update your dashboard to reflect the most current information, and ensure that data is pulled from reliable sources. Implementing automated data feeds can help maintain accuracy and reduce the risk of human error.
Analyzing and Interpreting KPI Data
Analyzing KPI data involves looking beyond the numbers to understand the underlying trends and patterns. Techniques such as comparative analysis, trend analysis, and benchmarking against industry standards can provide deeper insights into your association's performance.
Making Data-Driven Decisions Based on Dashboard Insights
Once you've analyzed the data, it's time to take action. Use the insights gained from your KPI dashboard to make informed decisions that drive your association's strategy. Whether it's adjusting your membership recruitment efforts or refining your event planning, data-driven decisions help ensure that your actions are aligned with your goals.
Troubleshooting Common Issues
Setting up a KPI dashboard can be challenging, with issues such as data integration issues, technical difficulties, or resistance from stakeholders.
For instance, 24.6% of organizations still insist on on-premise solutions due to integration concerns. This reluctance highlights the importance of addressing these integration challenges and finding solutions that ensure seamless data flow and effective dashboard functionality.
Addressing these challenges early on is crucial to ensuring that your dashboard is effective and reliable.
Solutions to Technical and Data Integration Problems
Technical problems and data integration issues can hinder the effectiveness of your KPI dashboard. Work closely with your AMS provider to troubleshoot any issues, and consider consulting with data experts to ensure that your dashboard functions smoothly.
Fuel Association Growth with Glue Up's Customizable Dashboards
Glue Up’s customizable dashboards provide a robust platform for setting and tracking KPIs tailored to your association’s needs. With Glue Up, you can:
- Define and Track KPIs: Set up dashboards to monitor the specific metrics that matter most to your organization.
- Visualize Data-Clearly: Use various visualization tools to display KPI data effectively.
- Integrate Data Sources: Ensure up-to-date and accurate information by integrating multiple data sources.
- Customize Reporting: Generate detailed reports focused on your key performance indicators.
- Adapt to Evolving Needs: Adjust KPI settings and dashboard layouts as your goals change.
Glue Up’s customizable dashboards empower you to manage and monitor your association's performance with precision and ease. Book a demo today to see how it works.


